

代码拉取完成,页面将自动刷新
Wiki | Community | Sponsors | GitHub | Gitee

A platform that Connect Data to Echarts.
![]()
![]()
![]()
![]()

![]()
![]()
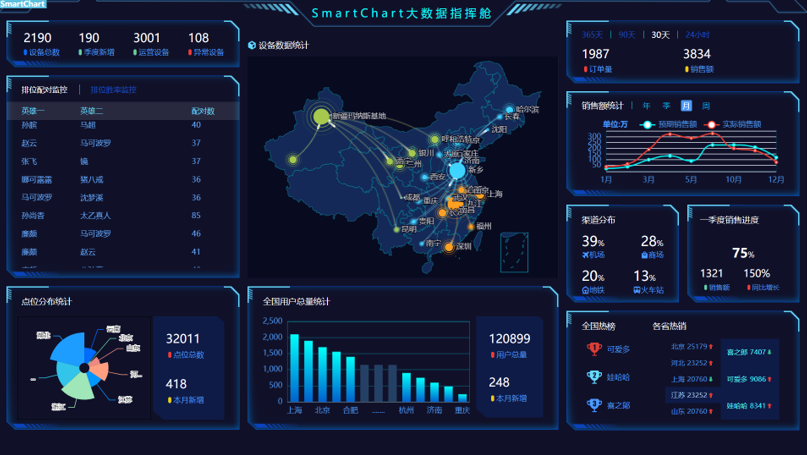
Smartchart is a microcode development platform for data visualization, large screen, mobile report and web applications
Simple, agile, efficient, universal and highly customizable, so that your project can be upgraded instantly
Fully open up the front and back ends, support graphic data linkage, filtering and drilling, and support almost all common databases
The building block development mode supports drag and drop layout, out of the box, simple installation, less dependence, and is suitable for various platforms
Support Django app plug-in application and jupyter data analysis application
Memory acceleration technology makes your data one step faster and greatly reduces the pressure on the database
No repeated learning cost, highly customizable, attention is highly customizable!!
If the download is too slow, you can go to Taobao mirror image download
You can also download windows 64 bit installation version
Mac computer installation version
Note: when Windows installs python, you need to select "add to path"
pip3 install smartchart


If the installation process is slow, it is recommended to use it

pip3 install -i https://pypi.tuna.tsinghua.edu.cn/simple smartchart -U


Upgrade method:

PIP3 install smartchart - U (upgrade)
smartchart getting started document entry
If you are not familiar with Django / python, you only need a visual development platform, which can be started quickly and used independently
Local command line startup:

smartchart

Or smartcharts (automatically open web pages)

If you are a server deployment, remote access, server startup method:

smartchart runserver 0.0.0.0:8000 --insecure --noreload
Administrator account password: admin / Admin, please change the password in time
smartchart getting started document entry
If you are a data analysis enthusiast and are using jupyter, pandas and other analysis tools, you can use them as visualization tools
It supports Python drawing tools such as pyecarts and Matplotlib to be used in Jupiter, which is more convenient and cool
There are only two commands, get and set, which can simplify the data analysis work, solidify the analyzed data and generate a cool dashboard
getting started with smartchart in jupyter
You can also use smartchart to make reports and embed reports in your application system
embedded smartchart report getting started document
If you are a developer of Django application, congratulations. It can be a seamless part of your project
The functions of data visualization, dashboard and low code API development platform are instantaneous
getting started with smartchart in Django -Django novices recommend downloading this project
Please download the gitee / GitHub project directly
pip install smartchart
Startup method: Python manage py runserver
Account number: admin / Admin
Smartchart can theoretically support any data source ,Mysql, SQLite, API and Excel data are supported by default. You can use Python connector to extend any data source
2020 / 12 / 14 static resource localization
v3. 9.8.2 support all common databases, Vue and datav
v3. 9.8.7 support Jupiter, one click sharing and application of dashboard template
v3. 9.8.9 account binding function online
v3. 9.8.10 user defined graphics management online
v3. 9.8.17 support the latest echarts5 0, optimize loading speed
v3. 9.8.20 user defined graphics management function upgrade
v3. 9.8.23 echarts upgrades to 5.0.1, which supports multiple queries corresponding to one dataset and resource localization
v3. 9.9.0 print function optimization, new pivot function, personal static resource path display, DB2 support
v3. 9.9.1 development interface beautification
v3. 9.9.5 optimize the development interface, fix regularly refresh the bug, add and delete batch datasets
v3. 9.9.7 add Python connector, data pool, customize main template and optimize development interface
v3. 9.9.10 you can write CSS in div settings, add built-in dynamic tables, optimize layout support, and add config files
v3. 9.9.12 optimize background data processing performance and jupyter experience
v3. 9.9.16 add template editing function, add embedded report token mode, optimize editing interface and connection pool selection
v3. 9.9.18 fix Vue bug, add elementui support and optimize datav development experience
v3. 9.9.24 add editing function in the template development interface, automatically create data set, add data set test function, and upgrade echarts to 5.2
v3. 9.9.25 add the prompt of unsaved changes, select and execute the dataset, and optimize the repeated submission of the saved template
v3. 9.9.28 admin adaptation UI, resource file optimization
v3. 9.9.33 add file upload function, add basesimple template and optimize development menu
v4. 0
-Cancel the bootstrap layout, adopt a new 24 grid or 12 grid layout, smaller file references and more convenient functions
-Add drag and drop layout without losing the free development mode, which can be mixed
-Add HTML component to distinguish it from dataset component
-A more user-friendly home page and a new UI experience automatically identify users and developers
-Optimize the development menu and enhance the user development experience
-The front-end development interface and background data set synchronization are completed
v5. 0
-Newly developed UI experience and optimized drag and drop
-Remove the bootstrap completely and reduce the installation package
-All 40 graphic themes are open
-New custom theme development function and new color palette
-Add embedded and pop-up window development switch
-Interface of linkage drilling
-Graphic editor optimization adds one click Import of common graphics
-Add template T3 compatible 3.0 Report
-Add data set development to set graphic linkage
-Add data set development to set cache and timing
-Adding data set development can be converted into shared data set with one click
v5. one
-Add offline initialization dB and add dataset external service API configuration
-Optimize static resources and add VIP template function
-Add one key to scroll tables and pictures, rotate graphics, and add one key to achieve border effect
-The enhanced experience removes the default loading of map JS, and all unusual JS are changed to dynamic loading
此处可能存在不合适展示的内容,页面不予展示。您可通过相关编辑功能自查并修改。
如您确认内容无涉及 不当用语 / 纯广告导流 / 暴力 / 低俗色情 / 侵权 / 盗版 / 虚假 / 无价值内容或违法国家有关法律法规的内容,可点击提交进行申诉,我们将尽快为您处理。


